Flot, a new plotting plugin for jQuery
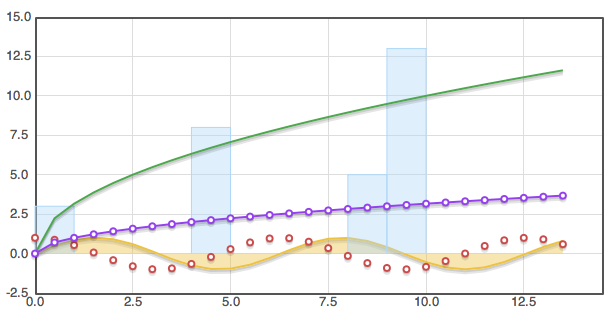
Here’s some holiday cheer: Flot, a new plotting library/plugin for jQuery by Ole Laursen. The initial 0.1 release has some stunning features, including interactivity with your charts. Flot looks very promising, and we like to highlight promising developments in the jQuery community!

See also:
Flot Announcement
Flot Examples
Ajaxian article on Flot
This is so cool, I can’t wait to integrate this on my site. I was looking at some server side options for making charts this past week and was very concerned about the future strain on server resources generating all those images … never mind caching issues.
This might just work for me!
WOW~ It is so cool and so useful for me, thanks for writer
What Greg said
Will be trying to find a project to use this on ASAP!
I tried the samples and it seemed speedy to me. Any chance of changing the data on the fly? Do you have to redraw the whole chart when you do so?
This just rocks! The visuals and styling are awesome, they don’t look pixelly at all.
Good!
Just started playing around with it and I see amazing potential.
One thing though, can you use non-numeric values for, say, the x-axis? Didn’t see it in the examples, and i’m trying to create a graph that displays numbers per month (e.g. I’d like the x-axis to display “11-07” for November 07.
Regardless, just plain awesome work. Thanks for sharing!
Nevermind…RTFM….reading the API I found the option to enter the tick array. Very helpful :-D
Pingback: links for 2007-12-08 at found_drama
I found it ironic that Google released their chart API just days after flot was released. http://code.google.com/apis/chart/
Didn’t that happen that jQuery and a CSS selector library were released on the same day? It is really funny how that happens. I will most certainly be trying them both these charting APIs out!
Pingback: links for 2007-12-09 « Breyten’s Dev Blog
Great, Version 0.2 is out. :)
Version 0.1 didn’t work for me the way I expected, I’ll give the new version a try.
R: you need to rerender the whole chart. This is mostly an artifact of how the canvas works – each time you perform a drawing operation, you’re changing the canvas surface. So there’s no easy way to remove and replot a line unless you introduce multiple layers of canvases. Maybe it would be a good idea if the Flot API would allow you to rerender the whole chart easily, though.
Dominik: If you’re having trouble, feel free to comment on the new brand-new Flot mailing list.
This is an excellent use of Canvas and is very easy to use. Can’t wait for upcoming versions
Mamamia…. Godsend
Well done, jQuery!
It has a big future!
I’m not jQuery fan but this is impressive.
Very nice! But the axis are off when printing in IE.
I like, I like
YAY! And is it possible to also zoom-out the view?
This is really pro.
Thanks jQuery!
Super!I’ll use them in my next project.
How about circle diagram, like in google-analytics?
Make it a part of Jquery UI as soon as possible!! Quickly! This is a killer feature!
Only one thing can be said about this framework, THE BEST
thanks JQ
Pingback: Flot, a new plotting plugin for jQuery | Development Feeds
Helloo
What’s the format time of the x-axis?!?!